Microsoft Fabric vs Power BI: Which One Does Your Organization Really Need?
Quick answer: No, Microsoft Fabric does not replace Power BI. Power BI is the reporting and visualization layer; Microsoft Fabric is the broader data platform underneath it, adding integration, storage, engineering, and governance on a shared foundation called OneLake. Choose Power BI alone if you mainly need dashboards. Choose Microsoft Fabric when scattered data, manual reporting, or AI readiness has become the real bottleneck.
Many organizations evaluating Microsoft Fabric already use Power BI and want to know whether Fabric replaces it, complements it, or addresses a different problem.
If your main goal is to build dashboards and reports, Power BI may be all you need. If you're wrestling with disconnected systems, inconsistent numbers, manual reporting processes, or getting your data AI-ready, Microsoft Fabric may provide the broader foundation you've been missing.
It's Not About Dashboards Anymore
A decade ago, most organizations relied on a handful of systems, including ERP, CRM, and spreadsheets. Merging this data was tedious but manageable. Today, the landscape has changed. Modern companies collect data from platforms such as Business Central, Dynamics 365, HubSpot, Salesforce, Microsoft 365, SharePoint, HR systems, project management tools, and industry-specific applications.
While each system works well on its own, data often remains siloed, making it harder to get a comprehensive, accurate view of the business. This is why discussions about Microsoft Fabric are common. It's not just about creating dashboards; it's about the time spent collecting, cleaning, and reconciling data to ensure those dashboards are trustworthy. Understanding this shift is key to grasping the differences between Power BI and Microsoft Fabric.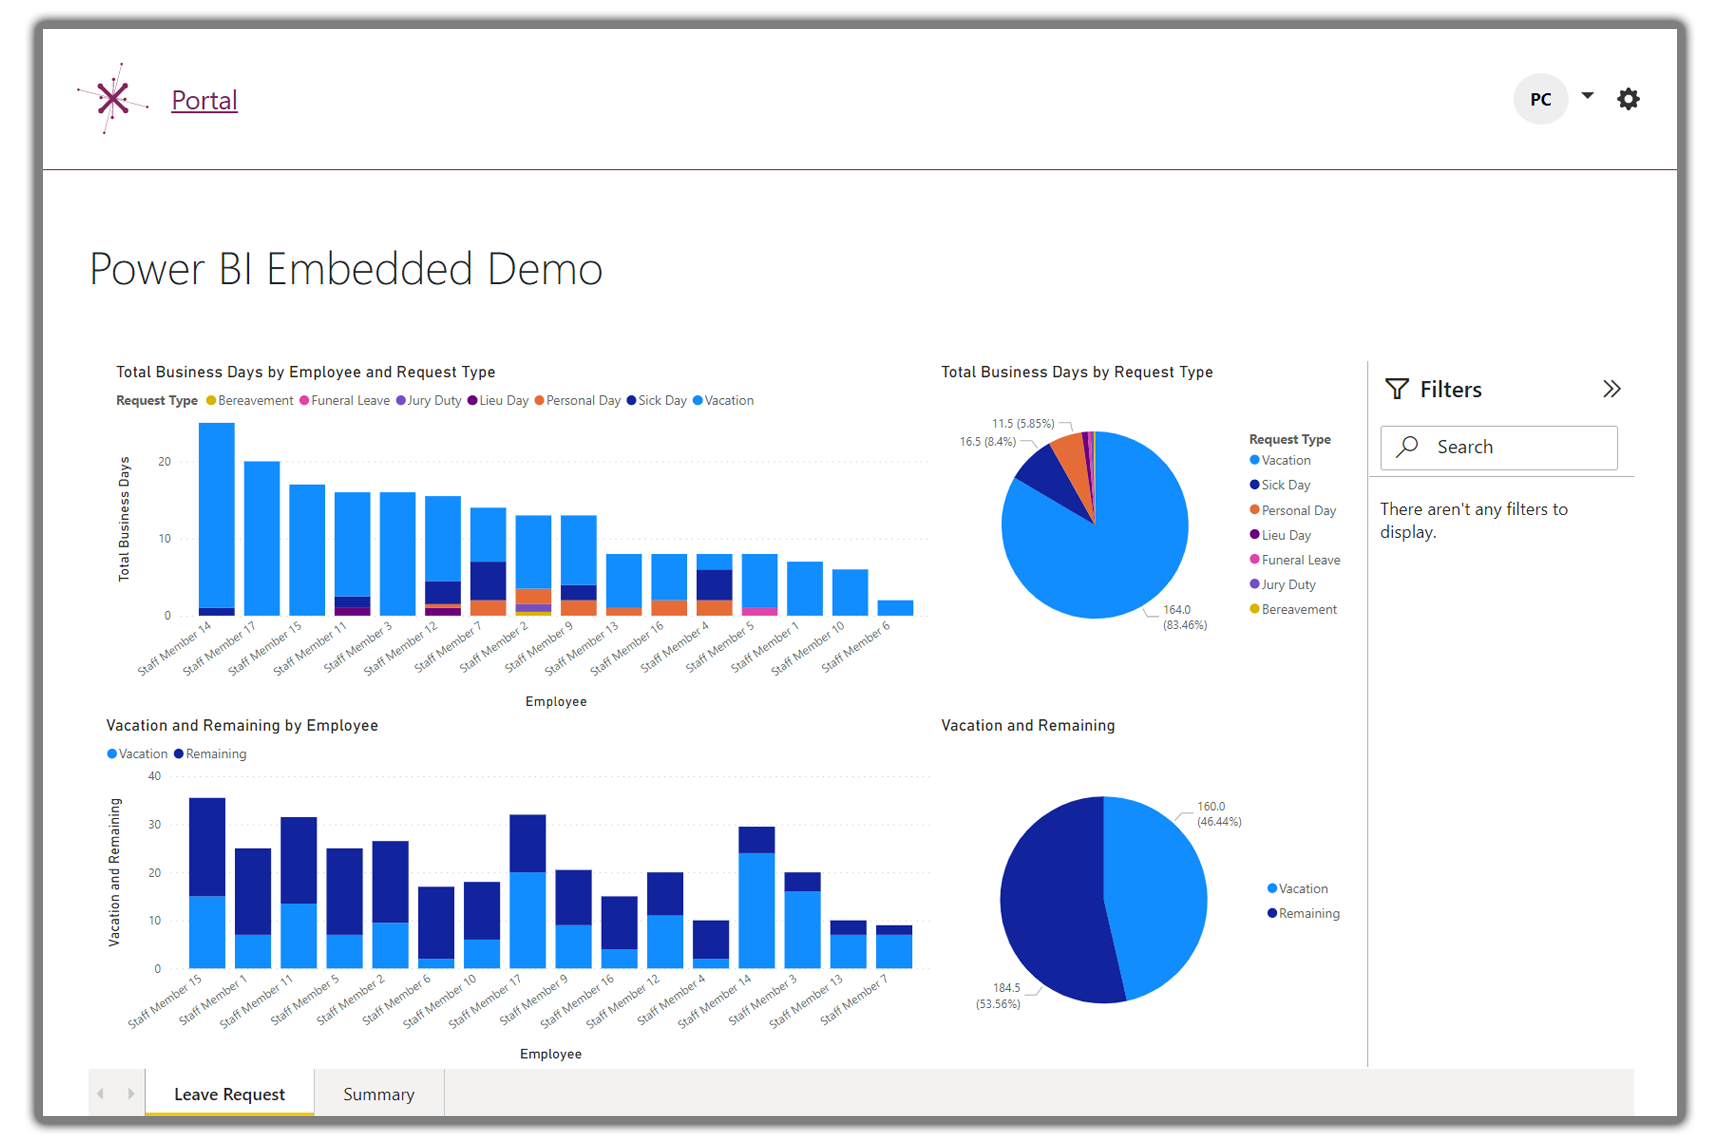
What Is Power BI?
Power BI has become one of the most widely used business intelligence tools in the world because it makes analytics accessible to everyone. Instead of relying on static spreadsheets or waiting for IT to generate reports, teams can connect directly to data, build interactive dashboards, and monitor performance themselves.
At its core, Power BI transforms data into insights. It enables users to visualize trends, track key metrics, and make informed decisions without advanced data engineering skills. For many business users, this tool is integral to daily operations.
Power BI has numerous use cases. A sales manager can track pipeline health and win rates; a CFO can analyze profit margins and cash flow; an operations team can monitor delivery times and service levels; and a leadership team can review company-wide key performance indicators (KPIs) in a single executive dashboard. In each scenario, Power BI fulfills its intended purpose.
However, Power BI makes one crucial assumption: the data feeding these reports is already in good condition. When information is scattered across systems, requires extensive cleanup, or lacks consistent governance, Power BI can only address part of the issue. While it excels at answering questions, it was never designed to manage the underlying data that supports those answers.
What Is Microsoft Fabric?
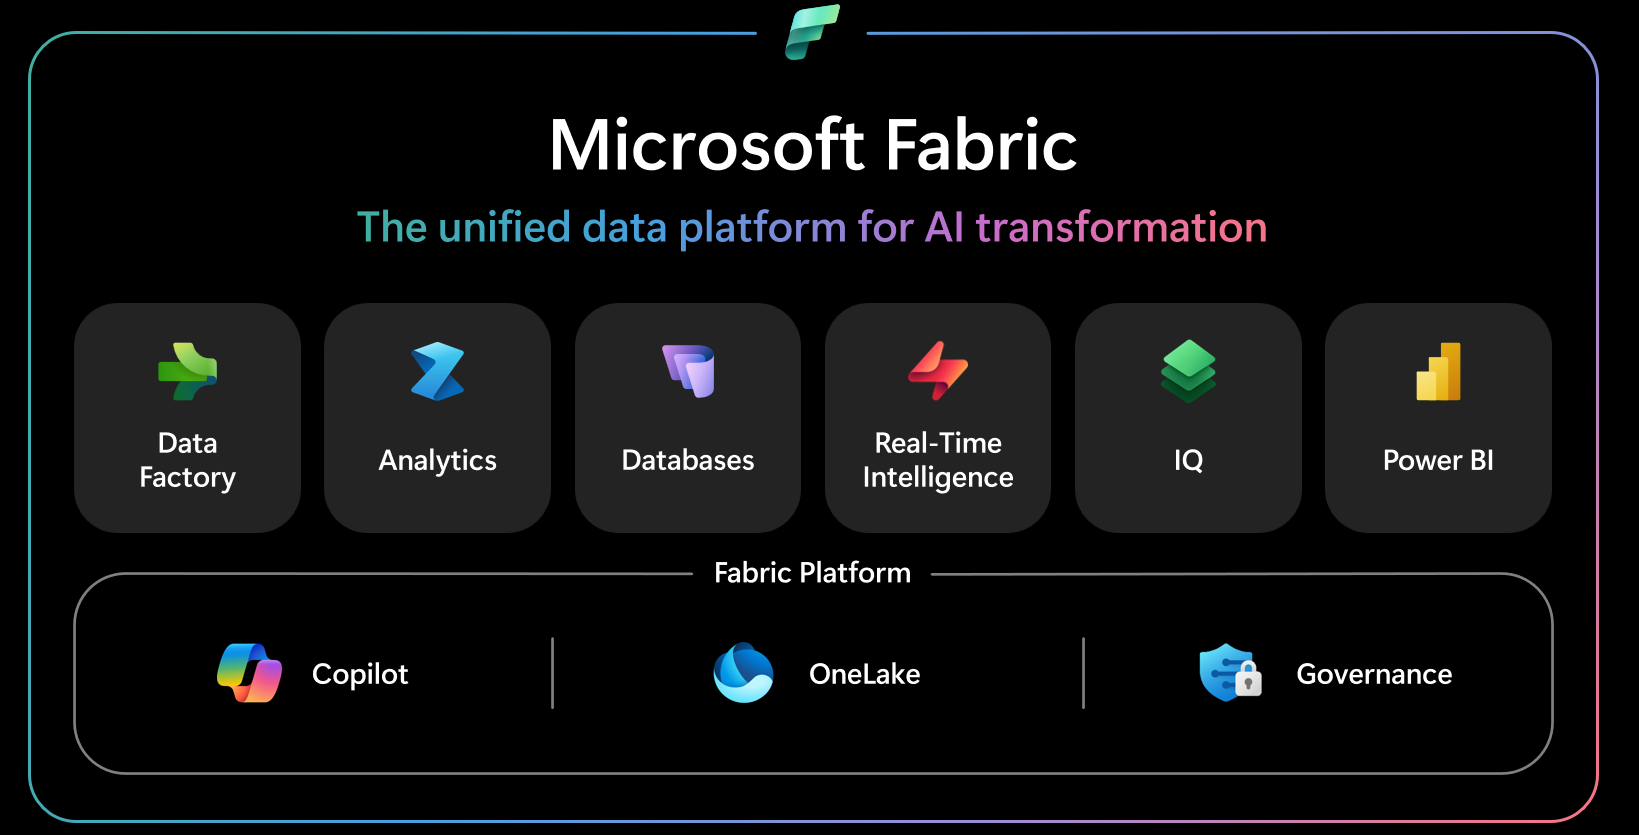
Microsoft Fabric is a unified analytics platform. Rather than requiring organizations to piece together multiple tools for data movement, storage, transformation, analysis, and reporting, Fabric integrates these capabilities into a single environment.
To better understand Fabric, let's break down its key components and their significance:
OneLake is the foundation of Fabric. It serves as a single source of truth for the entire organization, ensuring data is stored once and reused across tools rather than duplicated in multiple locations. Microsoft calls it the "OneDrive for data."
Data Factory ingests data. It connects to various systems, databases, and applications, moving data into OneLake through automated, repeatable pipelines rather than manual exports.
Lakehouse transforms raw data into usable data. It provides a space to store and process large volumes of information, ensuring the data is clean, structured, and ready for analysis.
Data Warehouse provides a familiar SQL-based environment for structured analytics and reporting, eliminating the infrastructure challenges often associated with traditional systems.
Power BI serves as the reporting layer, integrated directly into Fabric and providing native access to all data stored in OneLake.
The key point is that these components are not standalone products. Instead, they share a common foundation that enables organizations to operate with consistent, governed data across the organization.
Microsoft Fabric vs Power BI: Side-by-Side Comparison
| Capability | Power BI | Microsoft Fabric |
|---|---|---|
| Dashboards & Reports | ||
| Data Visualization | ||
| Self-Service Analytics | ||
| Data Integration Pipelines | ||
| Centralized Data Storage | ||
| Data Engineering | ||
| Data Warehousing | ||
| Real-Time Analytics | ||
| AI-Ready Data Foundation | ||
| End-to-End Governance |
The table above offers some insights, but the key differences lie beneath the surface.
Power BI and Fabric both excel at reporting and visualization, with Power BI serving as the reporting engine for both. If you need dashboards, the platforms look quite similar.
However, they differ in how they handle data integration. Power BI connects to many data sources and uses Power Query for simple data transformations, but it’s not built to manage large-scale data movement within an organization. In contrast, Fabric's Data Factory is designed for this and can operate at scale, on a schedule, with monitoring features.
The main difference is in how they manage and store data. Power BI uses datasets and models but doesn't offer a central data foundation for the organization. Fabric's OneLake provides a single governed copy of data, avoiding multiple disconnected versions. AI readiness depends on this foundation. Since AI tools depend on reliable data, Fabric's unified, governed foundation ensures data quality for AI applications.
The Real Difference: Reporting vs Data Foundation
Most comparison articles get stuck on features. A more useful way to frame it is this:
Power BI helps you understand what's happening in your business. Fabric helps ensure the data behind that understanding is accurate, organized, and trustworthy.
Here's a scenario that makes it concrete:
Imagine two organizations with identical Power BI dashboards: the same visuals, the same KPIs, the same executive summary. In the first organization, producing that dashboard takes an analyst several hours every month. They export spreadsheets from four systems, clean the data by hand, reconcile mismatches, and manually refresh the report before the leadership meeting.
In the second organization, the same dashboard refreshes automatically. Data flows from multiple systems into a governed foundation; transformations are applied consistently; and the numbers are trusted the moment they appear. The dashboards look the same. The architecture behind them is completely different.
Five Signs You've Outgrown Power BI Alone
Organizations rarely wake up suddenly needing a new analytics platform. Usually, reporting gradually becomes more difficult to maintain. Here are five common signs indicating this:
- Data is scattered across numerous systems, including ERP, CRM, SharePoint, spreadsheets, and various SaaS tools. The more sources integrated, the more fragile the reporting becomes.
- Reporting depends heavily on manual processes, such as exporting, cleaning, and reconciling data before it can be trusted. When your team spends more time preparing data than analyzing it, the issue lies in data management, not reporting
- Teams lose trust in the numbers. Sales has one figure, finance another, and operations a third, leading to meetings focused more on disputing numbers than making decisions.
- AI initiatives, like Copilot, AI search, or forecasting, quickly reveal underlying data problems. AI tools amplify messy data because they don't fix it.
- Growing analytics needs — more users, more data, and more complex requirements—are becoming harder to support with outdated systems.
If several of these signs look familiar, your reporting system has outgrown its foundational support.
Do Power BI Users Actually Need Microsoft Fabric?
Not always, and it's important to be honest about that.
You probably don't need Fabric if your reporting pulls from only a few systems, your data is already clean and consistent, your team can maintain reports with minimal manual effort, and dashboards are your main focus.
In such cases, adding Fabric could introduce unnecessary complexity. The best approach is to maximize the value of your existing Power BI setup. You might be ready for Fabric if your data is scattered across many platforms, reporting relies on manual steps, different teams provide conflicting numbers, governance is a growing concern, or AI and advanced analytics are part of your plans.
The key is to base your decision on your actual problems, not on the newest tool on the market. Fabric addresses specific challenges. If you don't face those challenges, you don't need it now.
Does Fabric Replace Power BI?
This is a common misconception worth clarifying: Fabric does not replace Power BI. Power BI remains a key component of Microsoft Fabric and continues as the main tool for report creation and data visualization. Your team can continue building reports with the same methods and skills in the familiar interface.
The difference lies in what happens behind the scenes. Instead of using scattered data sources and manual prep, organizations can now centralize and manage their data before it reaches the reporting stage. Importantly, adopting Fabric doesn’t require a complete overhaul. Existing Power BI reports still generate value, while the data foundation is gradually upgraded. This allows organizations to evolve their analytics gradually, making the transition more practical and manageable than many expect.
Fabric, AI, and Copilot Readiness
A successful AI strategy doesn’t start with the tools. While many organizations quickly deploy Copilot, AI-powered search, or forecasting models expecting quick wins, those that genuinely derive value from AI focus primarily on their data.
Copilot and other AI features rely on trusted, well-governed information. If data is scattered, inconsistent, or poorly managed, AI outputs can be unreliable or misleading. The technology itself may be sound, but flawed underlying data will produce flawed outcomes.
This is where Fabric plays a crucial role in a broader discussion beyond reporting. By integrating and governing data through OneLake, Fabric establishes a solid foundation that AI initiatives require. For organizations committed to leveraging Copilot and AI, ensuring a strong data layer is not just an option; it is a prerequisite for the success of their investments.
Microsoft Fabric vs. Power BI: How to Decide
Consider using Power BI if:
- Your primary focus is on dashboards and reporting.
- Your data originates from a limited number of sources.
- Maintaining reports is relatively straightforward.
- Governance and data quality are not major concerns.
Explore Microsoft Fabric if:
- Your data is scattered across multiple systems.
- Reporting involves manual efforts and requires spreadsheet cleanup.
- Different teams lack trust in the reported numbers.
- AI and advanced analytics are part of your strategic plans.
- Your analytical needs are expanding in scale and complexity.
For many organizations, the key question isn't simply "Fabric or Power BI?" but whether reporting alone is sufficient or whether it's time to invest in a more robust foundational sy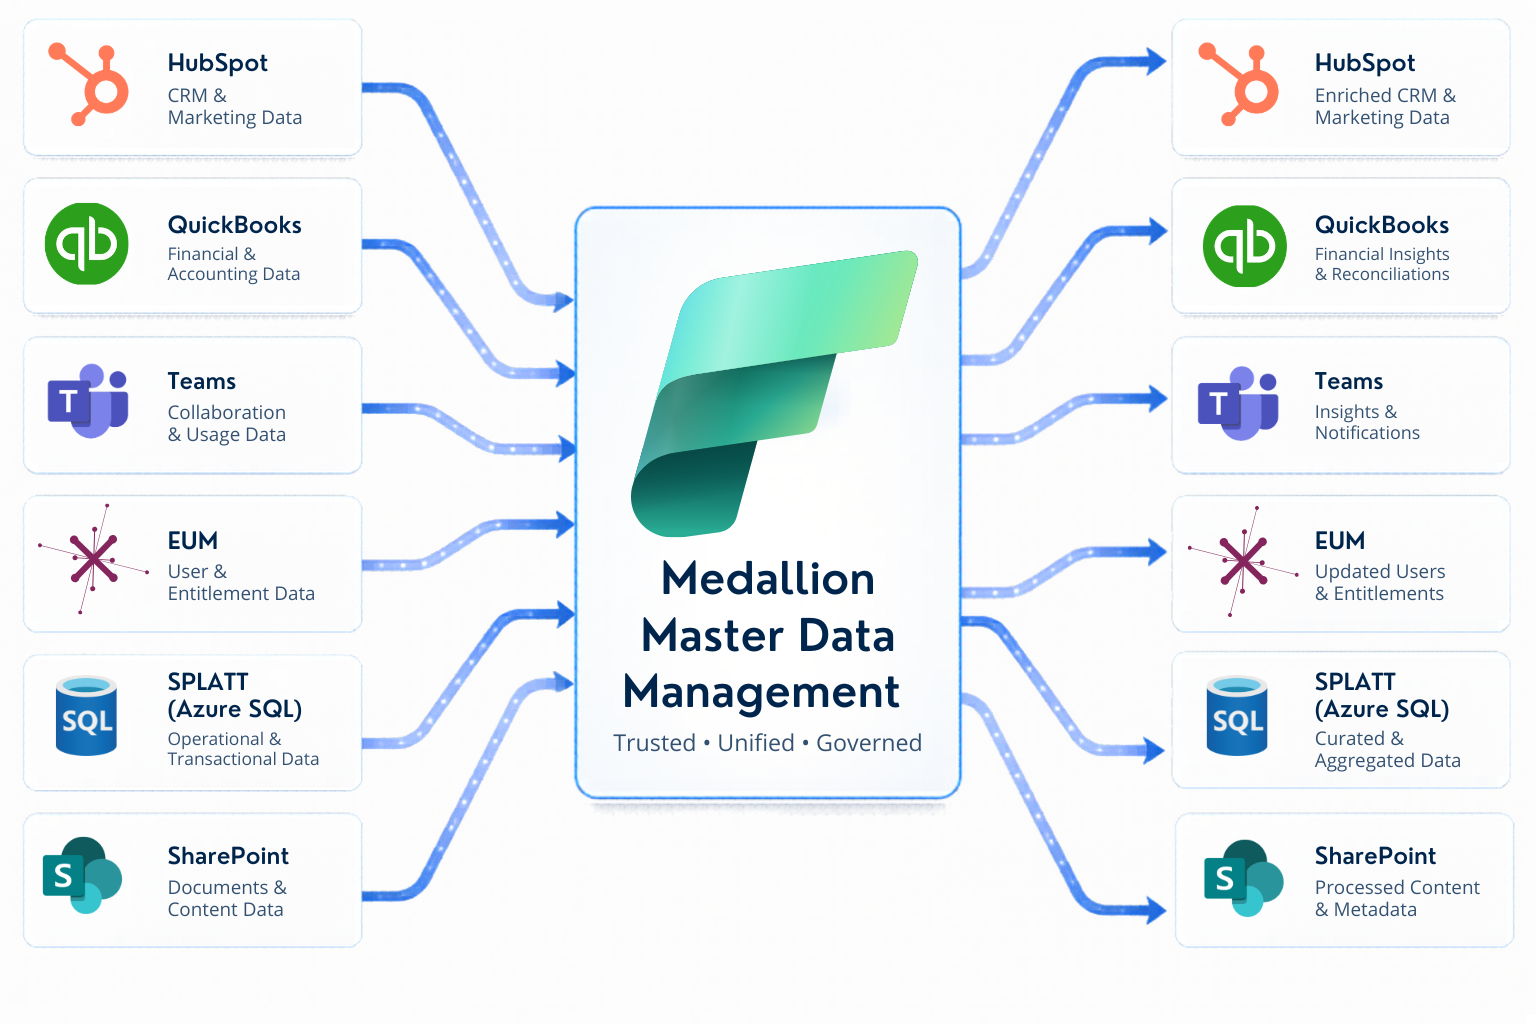
Start Building Your Microsoft Fabric Foundation
Power BI can show you the answers, but Microsoft Fabric helps create the trusted data foundation behind them.
Envision IT’s Microsoft Fabric Summer Webinar Series walks through the practical architecture we use to connect scattered SaaS systems and prepare data for Power BI, Copilot, and AI Search.
The three sessions are already available on demand. Start with the first session and follow the architecture as it takes shape, with practical walkthroughs hosted by Peter Carson, President of Envision IT and a 17-time Microsoft MVP.
Session 1: Getting Your SaaS Systems to Talk with Microsoft Fabric
Session 2: Teaching Your SaaS Systems to Listen
Session 3: Managing Fabric with Azure DevOps & Git
Find the Right Next Step for Your Data
The question isn’t simply whether Microsoft Fabric offers more than Power BI. It’s whether your current data and reporting setup can support your organization’s next steps.
A Microsoft Fabric assessment can help you uncover reporting bottlenecks, evaluate your data readiness for AI, and identify where Fabric could deliver practical value. We’ll review your current environment and recommend a realistic path forward tailored to your needs.
Book a Microsoft Fabric Assessment
Subscribe to Modern Work Monthly
Get the latest Microsoft 365 + Copilot insights to help your teams work smarter, faster.
We respect your inbox. Unsubscribe anytime.